The $51,000 New-Car Record Is a Ford and Stellantis Story, Not a Market-Wide One
October's record average says less about affordability than about two automakers: Ford and Stellantis priced up, while mainstream buyers traded down into compact SUVs rising twice as fast.
Contents · 7 parts
The average new vehicle sold in the U.S. in October went for $51,109, the highest figure Kelley Blue Book has ever recorded. On the same day, AAA's national average for regular gas slipped to $3.98, under $4 for the first time in weeks.
Put those two numbers side by side and the easy headline writes itself: cars cost more than ever. I don't buy that framing. Here's what the headlines miss: the record is two different stories glued into one average. At the top, Ford and Stellantis are taking far more money per vehicle than a year ago, while General Motors is not. At the bottom, the mainstream buyer is trading down, and the compact SUV they land in rose in price twice as fast as the headline.
Cox itself says the record is about mix
According to Cox Automotive's October ATP report, the industry average transaction price rose 1.3% from September and 2.1% from October 2025. That annual gain is below the 3.6% October average Cox has seen over the longer run. Average MSRP reached $52,933, up 2.4% a year, against a typical 3.3%. Incentives averaged $3,490, or 6.8% of ATP, up from 6.5% a year earlier but still below long-term norms.
In other words, the record arrived in a year of slower-than-normal price growth. Cox's executive analyst Erin Keating put it plainly: the average says as much about product mix as it is about affordability. She also noted that vehicles priced roughly $28,000 to $38,000 gained 9.6% in volume year over year.
That last number matters more than the record. The average is rising while a growing share of buyers shop well below it.
Two companies are doing the heavy lifting
The KBB data tables break the average down by automaker, and the spread is wider than any headline suggests.
| Oct 2025 | Oct 2026 | Change | |
|---|---|---|---|
| Stellantis | $54,878 | $59,947 | +9.2% |
| Ford Motor Co. | $58,548 | $62,326 | +6.5% |
| Toyota Motor Corp. | $45,477 | $47,118 | +3.6% |
| Honda Motor Co. | $39,037 | $39,288 | +0.6% |
| General Motors | $56,441 | $55,886 | −1.0% |
| Industry average | $50,055 | $51,109 | +2.1% |
Stellantis added about $5,070 per vehicle in a year. Ford added about $3,780. GM's average went the other way. So I'd correct my own starting assumption: this is not a Detroit story. It's a Ford and Stellantis story, and GM is the counterexample sitting in the same truck segment.
Inside those groups, the pattern repeats. Lincoln is up 11.3%, Dodge 8.8%, Jeep 7.2%, Ram 6.5%, Ford brand 6.2%. Meanwhile, the full-size pickup segment as a whole moved only 1.4%, to $67,912. Ram's average of $69,850 now sits above the segment and is rising more than four times faster.
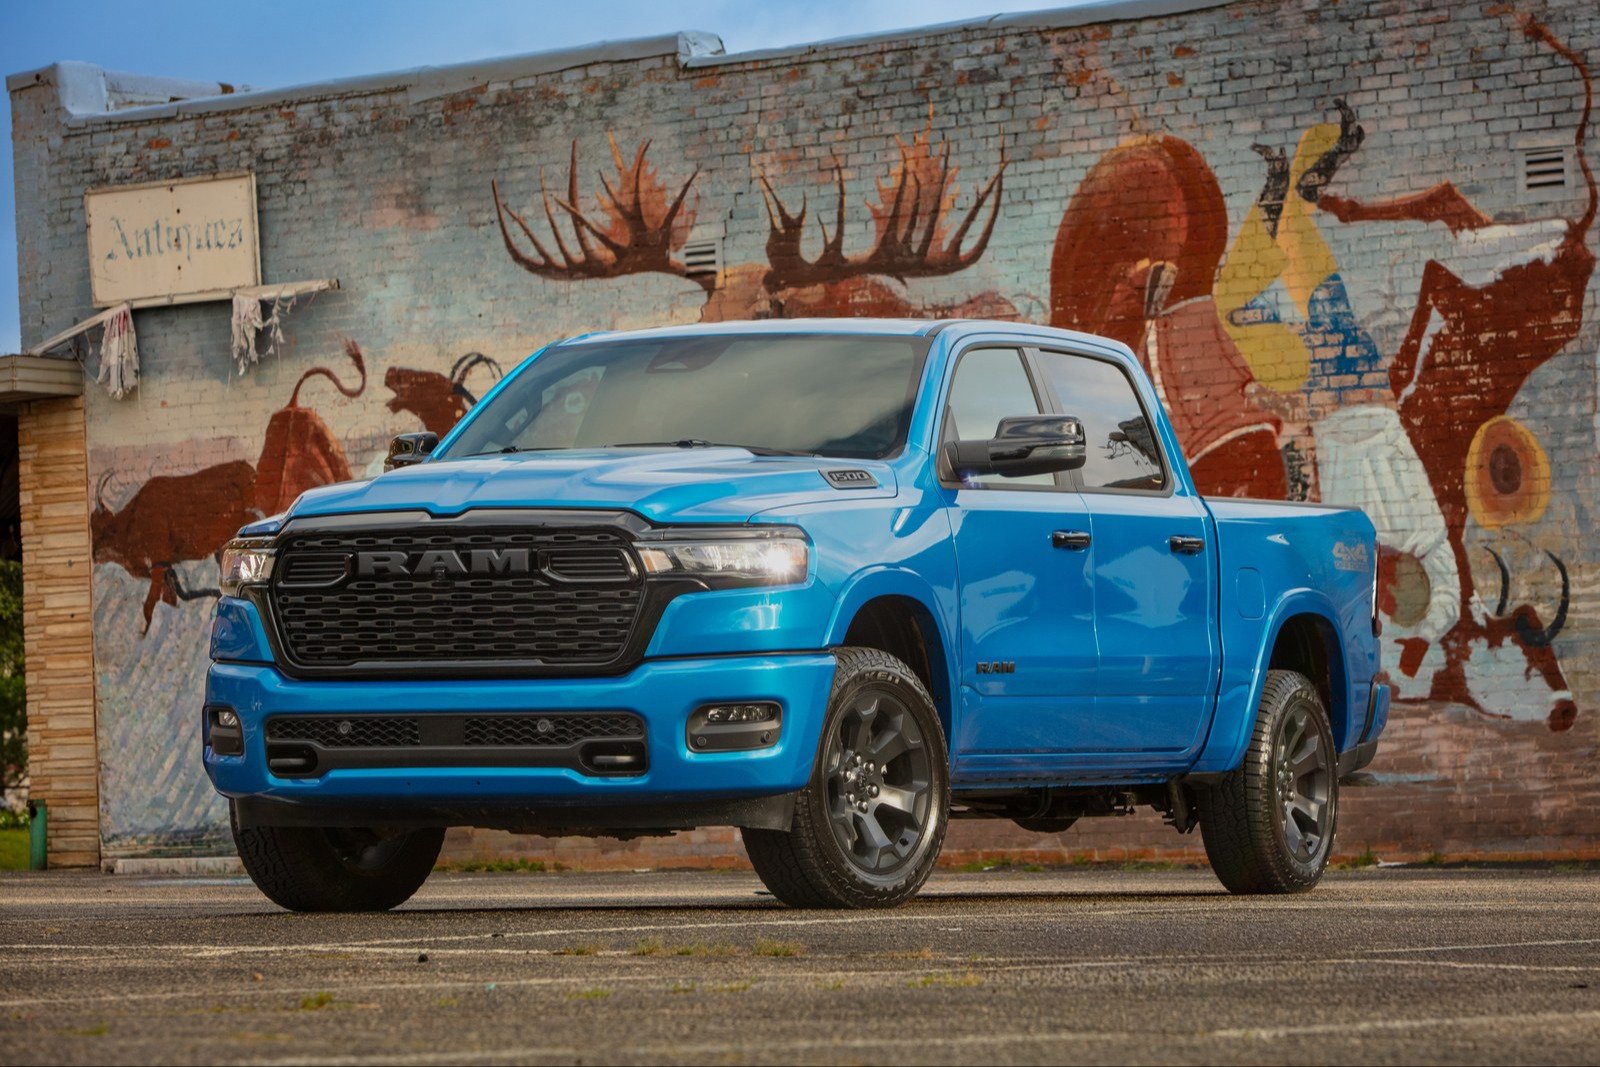
What strikes me is how much of that looks like lineup decisions rather than sticker shock on the same truck. Ram opened orders for the 2027 Ram 1500 TRX SRT at $99,995 in June, with deliveries starting in the summer, and is adding Rumble Bee muscle trucks from $59,995 late this year. Add a six-figure trim to the top of a high-volume nameplate and the brand average climbs even if nobody's base truck changed price. Cox's tables can't separate the two effects, and that's exactly why the record should be read carefully.
The squeeze is at the bottom, not the top
Now look at where most people actually shop. Three of the five highest-volume segments transacted well below the $51,109 average. Midsize SUVs, the top segment in October, averaged $50,570, up 1.9%. Compact SUVs averaged $37,895, up 4.3%. Compact cars averaged $28,030, up 3.4%.
That's the part of this report I'd put on the front page. The buyer of a full-size pickup saw the segment average move 1.4%. The buyer of a compact SUV, a far more typical household purchase, saw 4.3%. The headline overstates what happened to trucks and understates what happened to the cars people are trading down into.
There's a stranger data point in the same table. KBB's subcompact car category averaged $38,423, up 49.5% from $25,707. My read is that the cheapest small cars have largely left the market, leaving a handful of pricier models in the bucket. Cox doesn't name them, and with a sample that small I wouldn't build an argument on it. But it rhymes with the rest of the picture: the floor of the market keeps getting thinner.
I've argued before that the new-car market increasingly runs on buyers with stock portfolios. October fits that. The wealthy buyer keeps the top of the lineup moving. Everyone else is negotiating over a smaller menu.
Cheaper gas helps the side that's already winning
AAA put regular at $3.98 on November 10, down from $4.37 a month earlier. That's relief, but it's still roughly 30% above the $3.07 drivers paid a year ago.
My bet is that falling pump prices help Ford and Stellantis more than anyone. When gas was climbing past $4, the question was who could still afford to fuel an F-Series, and hybrids were stealing attention in the mainstream (I wrote about how the gas-only option quietly disappeared). If pump prices keep easing into the holidays, truck demand gets an excuse to firm up, and the industry average could climb again in November. That's a hypothesis, not a finding. Only next month's data can test it.
The case against my view
The strongest objection goes like this: mix is not a consolation. If buyers are moving down to $28,000–$38,000 vehicles because they can no longer stretch to $60,000, that shift is the affordability crisis, not a footnote to it. Calling it "mix" makes a squeeze sound like a preference.
There's a second point. ATP doesn't capture interest rates or insurance, and those have done more damage to monthly payments than sticker prices. A buyer doesn't pay $51,109. They pay a monthly number, and that number isn't in this report. Cox and Edmunds publish payment and rate data separately, and I don't have October's figures, so I won't guess at them.
I agree with more of this than you might expect. The bottom of the market is where affordability really bites, and that's my argument too. Where I part ways is the label. The $51,109 figure doesn't measure that squeeze. It's inflated by pricing decisions at two companies and by wealthier buyers choosing bigger trucks. If you want a number that tracks the pressure on ordinary households, the 4.3% on compact SUVs is a better one.
What would change my mind
If KBB's November report, due in December, shows GM, Toyota, and Honda catching up, with year-over-year gains of 4% or more while Ford and Stellantis flatten, then this is broad price inflation and not a two-company story. I'd say so.
If compact SUV prices fall back toward the industry rate over the next two monthly reports, the point about the squeeze at the bottom loses its force.
And if October payment data from Cox or Edmunds show monthly costs falling despite a record ATP, then the affordability debate shifts to financing, and the transaction price becomes the least useful number in the room.
My read
The $51,109 record is real, but it isn't the market moving together. It's Ford and Stellantis pricing up their trucks and big SUVs while GM holds, layered on top of buyers retreating into cheaper segments that are getting pricier faster than the average. The number to watch for most shoppers is $37,895 and its 4.3% climb. If gas keeps falling, I expect the headline average to set another record soon and to tell us even less.